
In a nutshell
The annuity vs. lump-sum decision is explored as a function of lump sum offered. Qualitative and quantitative considerations are reviewed, as well a tool is provided to allow consideration of: the required break-even return rates and stock allocations under various conditions, the impact of age when 60% (survivor benefit) kicks in, and pensioners’ longevity expectations according to latest actuarial recommendations. What, if any, impact the original plan percent funded/payout level has on the decision? The implications of annuity, which is an insurance rather than an investment, in the decision making process. Self-annuitization alternative is also considered including conditions when this might be a sensible option. Though framed in the Nortel pension plan context, it may be of educational value to others as well.
Background
Note that this is not intended to make a specific recommendation to you to select an annuity or a lump-sum, but purely considerations that I am using to explore my personal decision.
Decision time is here for Nortel‘s negotiated pension plan members, and is coming next spring for those (like myself) in the Managerial/Non-negotiated plan. A few weeks ago I listened in on a Morneau-Shepell/Koskie Minsky/NRPC webinar intended for Ontario members of the negotiated plan (other sessions for Quebec and other provinces’ members presumably customized for applicable procedures). The presentations were well done considering the complexity of the topic. However I have not seen any of the individualized “option” letters received by the negotiated plan members. Nevertheless, these presentations were of great interest to all Nortel pension plan members as the plans were likely then run and are now being wound-up very similarly.
The available options to plan members were explained: in Ontario the choice is between an annuity and a lump-sum (not to be confused with commuted value which is based on a current actuarially fair value, or with the cost of currently buying an individual annuity), while in Quebec (I believe) there is a third option to leave the funds with the RRQ for 5 or 10 years with a guarantee for an annuity in the future of at least the same value as offered now. Pension plan members were advised to hire their own financial advisors to make this complex but important decision among available options; if they fail to select an option the process will default to the annuity. I have not seen the windup report, as it is only available to negotiated plan members and at a substantial handling fee for a paper copy of the 100+ page report. (Are we in 1985 or 2015???)
The annuity vs. lump-sum decision would be non-trivial even if one was offered the current actuarial fair value, but it is even more challenging if what is being offered is 10% or 20% or even 100% less than current fair actuarial value, as mandated by the Ontario formula for calculating pensioners’ lump-sum. With this draconian lump-sum calculation, coupled with the use of much higher 2010 interest rates and out of date mortality tables not reflecting longevity improvements, the hard-fought LIF option by Nortel’s pensioners may essentially be rendered useless for the vast majority. Further adding to the confusions is the mischaracterization of the pensioners’ loss (41% given the 59% funded status indicated in 2010) as a result of the underfunded status of the plan, by claiming 70% or 75% or 80% funded/payout ratios by eliminating (the partial plan) indexation with a stroke of a pen (and including the PBGF protection for Ontario members) creating a further false sense of security when taking the annuity, which is in effect a trade-off between longevity and inflation risk.
In a recent Globe and Mail article entitled Three reasons to stick with a defined benefit pension plan Karin Mizgala recommended taking the pension unless one is sick and/or has shortened life expectancy, pension is not inflation protected and company (the pension plan sponsor is shaky financially.
The other important factor to consider is whether you need the insurance? After all, annuity is insurance not investment, and insurance is usually not cheap. Annuities/pensions trade-off longevity against inflation risk, and they come with insurance company/employer risk, loss of liquidity/control, no estate value. Given that insurance is typically expensive, the general principles to bear in mind when buying insurance are: (1) to buy insurance mostly/only against risks that you cannot bear and (2) the most appropriate risks to insure against are those which are low probability/frequency of occurrence but are very high negative impact events. (Given that by definition 50% of the people exceed life expectancy, longevity risk is not an obvious low probability event.)
The qualitative factors based decision using the statements in Figure 1- Qualitative factors driving toward annuity/pension and Figure 2- Qualitative factors driving away from annuity/pension in Annuity/Pension vs. Lump-Sum- Part 2: Drivers to and away from annuitization blog post broadly lead in part to the following conclusions:
-if you have no desire to leave an estate, have better than average health for your age group, you are an ultra-conservative investor, you are not a DIY investor and you might have to pay high fees to manage your assets, you understand and can live with the fact that an annuity is trading-off longevity risk for inflation risk, you are not worried about the financial health of your employer/insurance company’s ability to deliver on its annuity promise and/or other factors mentioned, etc… then you might be leaning to an annuity/pension
-if you have a desire to leave an estate, you are a do-it-yourself (DIY) investor, have average or higher risk tolerance with a history of investing in equities, your health is average or lower than average for your age, your pension plan is underfunded and are worried about your employer’s financial health or about insurance company meeting its annuity promises, or want to preserve liquidity and control over your assets, etc… then you might be leaning away from an annuity/pension
Note: to be conservative the market return assumptions in this blog post are much lower than those specified in Figure 1 of Annuity/Pension vs. Lump-Sum- Part 3: Quantitative considerations and assumed in Parts 1-5 blog posts of that series. Also, the M/F/Joint life expectancy tables need to be updated by adding about 2-2.5 years or about 10% to the numbers indicated Figure 1 of Annuity/Pension vs. Lump-Sum- Part 1: Making the right decision for you. ) “Canadian Pensioners’ Mortality”)
How much are pensioners getting: 59%, 75%, 79%, 100%? It’s pretty confusing…
The post bankruptcy valuation of the Nortel plan was assessed to be 59% as of the deemed windup date of October 10, 2010 (that’s over 5 years ago) presumably using government required interest rates (which are much lower today) and actuarially recommended life expectancies at the time (the growing longevity was fully understood then, but usually recognized with a lag, at the detriment of pensioners and the benefit of sponsors). The 59% valuation would have likely also included the impact of the partial (effectively about 1%/year if I recall correctly) indexation of the plan.
Ontario plan members’ first $1,000/month pension is protected by Ontario’s PBGF, but without indexation. So while initially one starts with a higher annual nominal income as promised indexation is eliminated (i.e. apparent lesser decrease in income as a result of the plan deficiency) , the losses due to inflation grow annually thereafter; loss of approximately 1% indexation of the plan is equivalent to a NPV erosion of about 5%/9%/13% of pension over 10/20/30 years; $1 of un-indexed pension will shrink in buying power to $0.82/$0.67/$0.55 after 10/20/30 years, i.e. for older pensioners (with fewer years on the average to collect pension) the impact is much smaller, while for younger ones it is a serious concern. To speak about percent funded plan comparing an indexed with an un-indexed income stream, after dropping indexation of a plan, is a misleading measure of its impact unless one’s life expectancy is under 5 years. Instead we’ll use the cost of buying an un-indexed nominal individual annuity from an insurance company as a reference point (which in turn can be further increased to reflect any original indexation) and we’ll compare the lump-sum offer against it.
So what is the impact of assuming October 1, 2010 as the windup date?
The 10YR Government of Canada bond rate has dropped from 3.25% to 1.5% between October 2010 and 2015. The NPV of a 10/20/30 year income stream at a discount rate of 3.25% compared to 1.5% is about 10%/18%/26% lower, so those considering taking cash value will not likely be able to get anything close to current fair actuarial value or current cost of buying such an annuity, even without considering their extended life expectancy now, five years later than in 2010. Also, the new mortality tables effective October 1, 2015 recognize about 10% increase in longevity at all ages which would translate to a about 9% increase in NPV (unlikely to have been accounted for given the deemed windup date of October 2010) . So even setting aside the draconian formula prescribed by the government described in Nortel pensions: Why CV/LIF value is less than annuity value for Nortel’s Ontario pensioners? the odds appear stacked against those thinking of taking lump-sum rather than the annuity offered instead of the pension (This is actually difficult to understand since the plan’s cost to purchase annuities is likely significantly higher than if more pensioners takes lump-sum, so drastically lower lump-sum offers will likely drive even more people toward the annuity option.) Besides people who are in poor health (especially those expecting to die in the very near term 6-24 months), deferred pension plan members who can transfer the lump-sum into a LIF without being subject to taxes are likely in the best position to benefit from the offer to put the money in a LIF (or possibly even a LIRA).
Lack of access to a windup report limits the available information which might help better understand to what extent equitable treatment of: different members from different provinces, different age groups (and other demographics), and those taking annuities vs. those taking lump sum payout were affected by the mechanics that went in the calculation of the reduced pensions.
Having said that, I imagine that there is little that can be done, other than play the cards that pension plan members have been dealt in this round of play. The essence of those cards can be captured by two numbers you are given, the annuity income and the lump sum.
So will it be an annuity or a lump sum?
Ontario pensioners get to choose between an un-indexed annuity (a lifetime income stream without inflation adjustment) and a lump sum payout.
To make a decision on annuity or lump sum, our first reaction might be to try to figure out whether we get a ‘fair’ (in some sense) lump sum. This could be done by understanding the process by which the lump sum was calculated, probably a non-starter (and it turns out mostly irrelevant) given the limited information available on the process followed.
A much easier approach is to just see how much of an annuity would the lump-sum buy us. This could be done by going to the Cannex annuity link available for Globe and Mail subscribers (or to Cannex directly where they sell this type of service.) On November 30, 2015 the best annuity that $100,000 could buy for a 65 year old couple with no guaranteed payment period (i.e. at least one of the couple has to be alive for the payment to continue) was about $444/month or $5328/year (i.e. annuity rate of 5.33%, but this is not interest, but a combination of interest plus one’s own principal plus some mortality credits resulting from the death of others). And let’s guesstimate that the impact of reducing the survivor benefit from 100% to 60% increases the annuity by about 5% to about $5600/year (i.e. an annuity rate of 5.6%). For a 65 year old female the annuity rate would be about 5.9%, while for a male about 6.5% due to the shorter corresponding life expectancies. So you can compare the annuity that you could buy for the lump sum offered, to the annuity that you actually received, and you can get an idea how much lower the lump sum is than would be fair as measured by the current cost of annuities. It has been implied that the lump sum offered will be much lower than the cost to buy the offered annuity today.
Therefore for healthy and conservative pensioners with low risk tolerance, who would normally only invest in GICs especially if they would need an annuity to meet their fixed expenses, taking the annuity rather than the lump sum might make sense. At the other end of the decision spectrum would be somebody who might have been told that they have a terminal illness with (to the extent that this is predictable) less than one year to live, for whom it might make sense to take the lump sum and use it to improve his remaining year of life and/or perhaps even leave some for the estate.
But some/most people fall somewhere in-between these bookends, and to explore this for myself I extended the spreadsheet which I discussed in Stocks in retirement? Asset allocation considerations in retirement by adding a calculator which allows comparison of IRR of the annuity (depending on when death might occur) and the stock allocation (risk) that would be required to achieve that return (which we’ll call break-even return), and check whether that is consistent with the maximum stock allocation appropriate the circumstances of this individual.
An Example
A couple:
Age=65,
Assets=$500K,
Pensions: Current Reduced Nortel=$20K Other Pensions=$25K
Expenses: Fixed=$40K Discretionary: L1= $0K (takes time to shed), L2=$15K (can be eliminated fast)
Tax Rate (Average) = 10%
If the annuity rate was about 5.6% for a 65 year old couple it would take almost $360K to buy the $20K annuity at the November 30, 2015 rate. We’ll explore the impact of being offered less than the $360K for the $20K annuity for a 65 year old couple.
This couple likely could comfortably function within the current financial boundary conditions of $45K pension and $500K of assets, given their expenses. Of course the purchasing power of the un-indexed $20K pension would only be about $11K after 30 years, but still not bad given their expenses and available resources.
Beside the qualitative factors driving one toward or away from an annuity, risk tolerance of an individual is determined by willingness and ability to take risk. Indicators of willingness might what the individual has invested in before (someone who always restricted their investments to bonds and GIC/CDs has low willingness to take risk). Also people who have invested in stocks in the past but bailed out of the market after it dropped have demonstrated less willingness to take risk than they previously assumed. However, understanding one’s ability to take risk needs to be approached more quantitatively. So I enhanced my earlier spreadsheet to try to address this to make my lump-sum vs. annuity decision. Exploration of the scenarios can be done in the enhanced spread sheet (you will have to download spreadsheet to your computer to make changes).
The Base scenario assumes that annuity is taken:
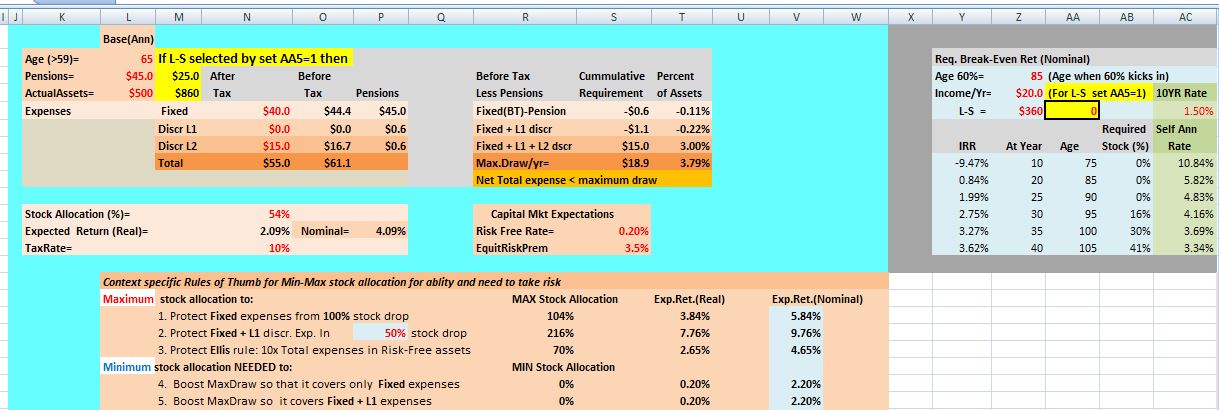
The lump sum scenario can be obtained by setting cell AA5=1 after entering the annual annuity payout and the offered lump sum in the table at the top right side of the spreadsheet:
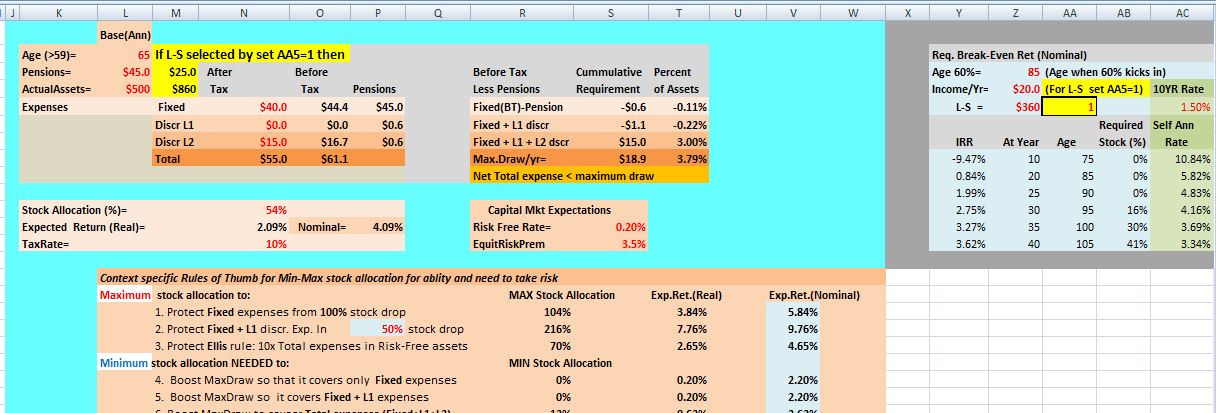
This top-right-hand corner table also calculates the IIR or required return on the lump sum to deliver the payment stream of the annuity for various number of payouts (years lived until death):

The following table summarizes the scenarios of taking: Annuity, Lump Sum =$280K, Lump Sum= $320K and Lump Sum= $360K (with $360K being the current cost of purchasing an individual annuity from an insurance company). Joint- age 95 is about highest 75th-percentile life-expectancy for a 65 year old couple. The assumption here is that the 60% level of spousal/survivor benefit kicks in at age 90 (as specified in cell=Z3 of the table in the top right hand corner of the spreadsheet.
Maximum Stock Allocation to Protect:
| Annuity | Lump Sum= $280K | Lump Sum= $320K | Lump Sum= $360K | |
| Fixed expenses 100% Stock Drop | 104% | 10% | 14% | 18% |
| Fixed+L1 expenses
50% stock drop |
216% | 19% | 28% | 36% |
| Ellis rule: 10x Total expenses In risk-free assets | 70% | 54% | 56% | 58% |
| Break-Even | ||||
| Break-Even at joint age=95 (75th %-tile)
60% at age 90 |
Req. Stock Alloc. Required Return
SelfAnnuitization |
94%
5.49% 4.16% |
59%
4.26% 4.16% |
30%
3.24% 4.16%
|
| Break-Even at joint age=95 (75th %-tile)
60% at age 85 |
Req. Stock Alloc. Required Return
SelfAnnuitization |
81%
5.04% 4.16% |
45%
3.79% 4.16% |
16%
2.75% 4.16% |
Therefore at Lump Sum= $360K to protect Fixed Expenses from a 100% and 50% stock drop (in this case where L1=$0K) the maximum stock allocation permissible would respectively be 18% and 36%; the 36% maximum permitted stock allocation, acceptable in case of a 50% stock drop, exceeds the required 30% stock allocation achieve the break-even 3.24% return at the 75th percentile joint age of 95, so it might be workable. When the Lump Sum is reduced (keeping the annuity still at $20K) to $320K (-11%) and $280K (-22%) the maximum permissible stock allocations for a 50% drop in stock value, becomes 28% and 19%, which are well below the required returns/stock allocations for the break-even return at age 95. Note that at Lump Sum= $320K, the Ellis rule derived maximum stock allocation is 56%, which is in the same ballpark as the 59% stock allocation required for the break-even return at the 75th-percentile age of 95 if survivor benefit of 60% kicks in at age 90.
If the spouse which was the employee is in poorer health and is assumed to die at age 85 (rather than 90), and income stream reduced to 60% at age 85, then assuming the above outcome, it would suggest that taking the lump sum at $360K is a no brainer, but even at $320K might be workable requiring a stock allocation of only 45%. Furthermore even self-annuitization at current 10YR government bond rate of 1.5% would work, delivering 4.16% to age 95 (and 3.69% at age 100)
At $280K (-22% of fair value) it would require a shorter joint life expectancy assumption of age 91 to make self-annuitization work with a risk-free portfolio, or one might consider injecting a stock allocation of up to 54% (using Ellis rule constraint on maximum stock allocation) to increase expected return.
The self-annuitization option can be executed (risk-free excluding inflation impact) without using an insurance company, is also shown in the last column (green background) of the top right hand side of the spreadsheet. Here we assume that we invest the lump-sum value at the (nominal 10YR) risk-free government bond rate of 1.5%, then selecting a fixed number of years that we want to generate constant nominal income from the lump-sum, we can draw 10.84%/5.82%/4.16%/3.34% over 10/20/30/40 years before the asset is exhausted. While self-annuitization would typically deliver somewhat less than the 5.6% annuitization rate for terms over 21 years, the advantages include keeping control of the assets and should both of this 65 year old couple die before the target number of years the remaining assets would be available to the estate; clearly a credible option for couples with lower than average health and a history of lower than average longevity. Self-annuitization to joint age 95 (75th percentile longevity) would deliver 4.16%.
Bottom line
As indicated earlier, these are not recommendations for you, but considerations which I plan to use to make my decision when that time will come. I make no guarantees that calculations or for that matter my opinions/views are error free and/or won’t change as I gain further insights.
So the decision is non-trivial, but ultimately an annuity is insurance and not investment and one must determine if one needs insurance. For example, if one has chosen lump sum but has other assets not included in the investable category (e.g. a house that one is living in at age 65), one could use that asset as a backstop should one end up living much longer than the 75th percentile (age 95 for this couple); this in fact may even be necessary for those who have chosen an annuity, given that as little as 2% annual inflation will reduce the purchasing power of a nominal annuity over 30 years by 45%!
Other RetirementAction.com blog posts covering the annuity vs. lump-sum considerations are:
Annuity or Lump-Sum (LIF): Upcoming Nortel pensioners’ decision
Nortel pensions: Why CV/LIF value is less than annuity value for Nortel’s Ontario pensioners?
Annuity/Pension vs. Lump-Sum- Part 1: Making the right decision for you
Annuity/Pension vs. Lump-Sum- Part 2: Drivers to and away from annuitization
Annuity/Pension vs. Lump-Sum- Part 3: Quantitative considerations
Annuity/Pension vs. Lump-sum- Part 5: Putting it all together
