
In a nutshell
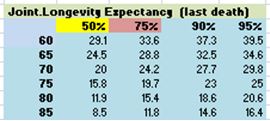
Putting it altogether, you are now ready to explore your own personal situation for the annuity/pension vs. lump sum decision. If you are reading this Part 5 blog post of the final one of this series, then you have already ploughed through the first four parts: Annuity/Pension vs. Lump-Sum- Part 1: Making the right decision for you where we looked at risks in retirement, Annuity/Pension vs. Lump-Sum- Part 2: Drivers to and away from annuitization which is focused on qualitative considerations toward the annuity/pension vs. lump-sum decision, Annuity/Pension vs. Lump-Sum- Part 3: Quantitative considerations where we explored quantitative considerations in the decision, and Annuity/Pension vs. Lump-Sum- Part 4: Monte Carlo simulation to explore retirement income trade-offs with and without annuitization where we use Monte Carlo simulation to explore the range potential outcomes given assumed Capital Market Expectations, (risk tolerance and corresponding) Asset Allocation, in the context of personal circumstances (Age, Assets, Expenses, Other Lifetime Income sources and the resulting required withdrawal rate) and compare these with annuitization. To help see the entire picture, I have taken here another example, in this case an 85 year old single male with a life expectancy (i.e. 50th percentile) of the order of 5 years and a 90th percentile life expectancy of about 11 years, instead of the previously used, 67 year old couple who need to finance a potentially 30 year long retirement.
The details
If you read this far the previous four Parts, then you are ready to try your own circumstances and scenarios to help you better understand the trade-offs between pension/annuity vs. lump-sum. Remember that the annuity/pension vs. lump sum is approached NOT with the objective to maximize lifetime income, BUT to secure the income necessary to cover the total expenses AND maximize the NPV of all future cash flows to oneself and ultimately to the beneficiaries of the estate. So consider the following context:
Context
Let’s work through a new example:
-85 year old single male
-Risk free rate=2.5%
-Net expenses (i.e. after deducting pension income) = $35K
-Asset (scenarios) = $250K, $500K and $750K
…and let’s work through the necessary steps for this example:
- Fully understand your annual Total expenses and separate the Fixed and Discretionary expenses: Total expenses= Fixed + Discretionary (See the Expenses: Fixed and Discretionary section (Part 3 of this series of blog posts)
- Asses where you stand on the Qualitative factors driving you toward Figure 1 or away Figure 2 (Part 2) from annuity/pension (e.g. an individual who might lean toward an annuity/pensions especially an inflation indexed one is someone who has the following attributes: a very conservative investor, can’t manage his/her own investments, has no desire to leave an estate and is in good health plus other factors). Next consider quantitative data:
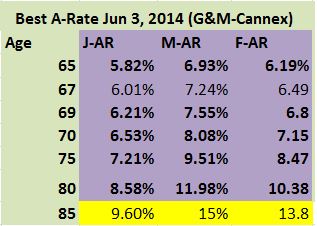
- Get annuity quote(s) from some highly rated insurance company (initially one may be able to get approximate annuity rates from public sources (e.g. Cannex for Canada and ImmediateAnnuities.com or around mid-2014 Figure 6 in Part 3). Annuity rate for 85 year old male is about 15% from Table (Best A-rate June 3…) below
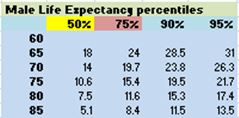
- Though not a necessary step for what follows, but if you’d like to check the Internal Rate of Return (IRR) you can find it by trying different rates in an NPV calculator (e.g. an Excel function) which delivers a NPV=$100 for a sequence of annual cash flows corresponding to what $100 would buy at the quoted annuity rate or in a financial calculator which has an explicit IRR function, in any number of years of such cash flows (until assumed death), but at least consider the 50th, 75th and perhaps even 90th percentile life expectancy ages (by referring to Figure 1 in Part 1, also reproduced below ) and compare the IRR to what risk-free (or even low-risk) alternatives could deliver to understand whether there is sufficient benefit to give up control over assets (remember that if you are a young retiree you are trading off longevity for inflation risk)
- Subtract from expenses any existing lifetime income sources (government or private pensions); if inflation indexed and have high confidence in its delivery include 100%, if not inflation indexed you might consider de-rating it to about 80% of its value as an average over a 25-30 year retirement.
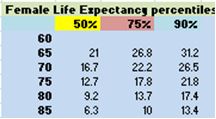
- Determine your 50th, 75th and 90th percentile life expectancy applicable to you situation (male, female or joint) by referring to Figure 1 (Part 1) reproduced below
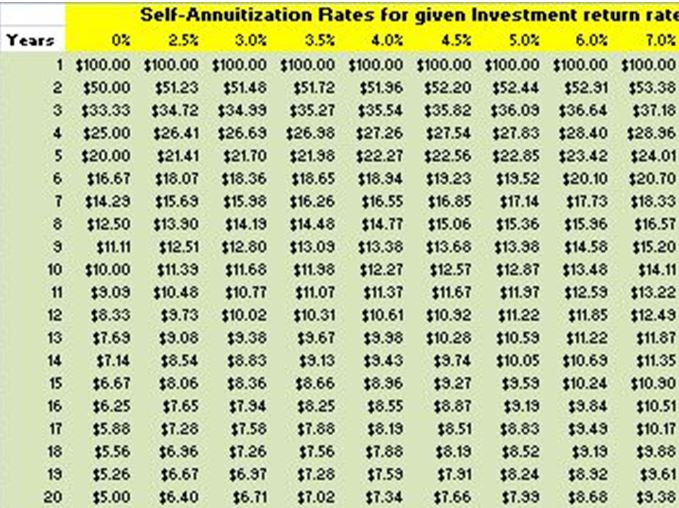
- Go to self-annuitization Table (created for $100 investment) Figure 7 (Part 3), also reproduced in this section just below the summary Table which follows, and determine the minimum (risk-free) return rate (top line) to get the same annual income up to the 50th, 75th and 90th percentile ages, as promised by the annuity rate at $250K, and to meet required income ($35K/yr) with $250K, $500K and $750K using a systematic withdrawal approach
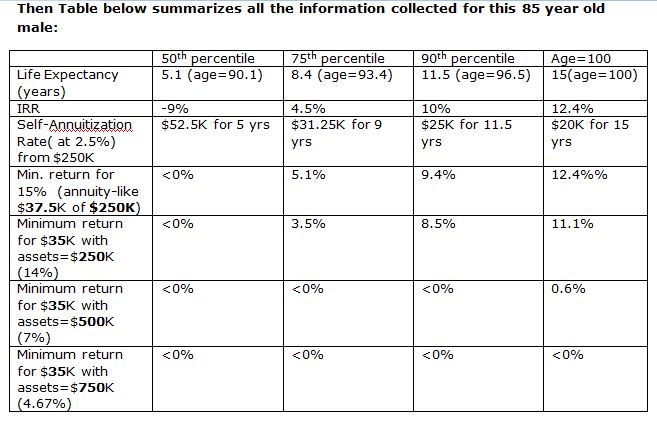
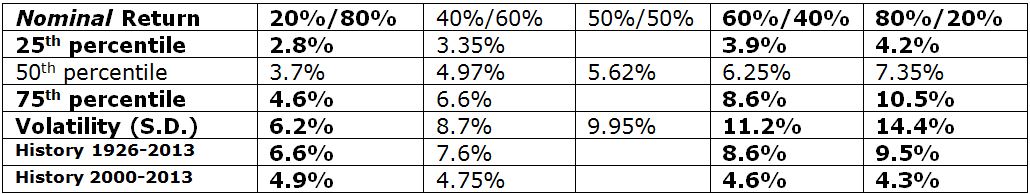
- What the above suggests that with $250K assets to achieve annuity-like $37.5K/yr or 15% annuity-rate payout from $250K is unrealistic to expect to achieve with a systematic withdrawal strategy from even a 60% stock portfolio with expected return of 6.25% but which has a standard deviation of 11.2% from the Capital Market Expectation table (also shown below); and the same is true for the required income of $35K from the $250K portfolio. Also see the proposed ‘risk tolerance’ Stress Test section below.
The self-annuitization Table below shows the annual income which can be generated from $100 principal at the return rate show at the top and the specified number of years on the left:
Does this return appear achievable in the context of current Capital Market Expectations given in Figure 1 (Part 3), reproduced below? What asset allocation would be required? Think of this as the lowest required stock allocation to achieve the desired return
Table- Capital Market Expectations
- As a measure of risk tolerance (i.e. how one would react/handle emotionally and financially) assume a 50% drop in the stock market, and see if we would still have sufficient assets remaining to purchase an annuity greater than or equal to the our expenses. This Stress Test can be executed by looking in Box 3 of Monte Carlo spreadsheet, specifying 50% under MktFall and comparing the assets remaining after such a drop below each indicated asset allocation, and comparing these assets with the Required Income calculated in Box 2 of the Monte Carlo spreadsheet. (So if annuity rate is 6% and your Required Income (after deducting other lifetime income) of $60K then you need $1,000K ($1M) assets after the 50% drop. Note the highest asset allocation which still leaves assets greater than or equal to the assets required for annuitization; think of this allocation as the highest permissible stock allocation.
- Applying this 50% stress test at the $35K/yr income and $250K asset level, indicates that the most aggressive permitted allocation would be about 20% equity (Min req’d assets=$259K) which has an expected return of about 3.7% (from Capital Market Expectation table below). This would be insufficient at even to 75th percentile longevity (sustained) minimum return of >3.5% given uncertainty associated with the standard deviation) or that at least $333K of assets would be required to initiate this approach at the 60% equity allocation level. So this is somewhat of an unrealistic situation which increasingly would drive us to an annuity (if expenses cannot be reduced further). See Box-3 (below) from the spreadsheet
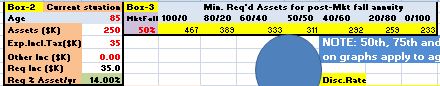
On the other hand, at the $500K and $750K asset level (both exceed Min. Req’d Assets in Box-3 above) a systematic withdrawal appears to be very workable for delivery of a $35K/yr until 75th and 90th age percentiles or even age 100, as we will explore with the Monte Carlo simulation.
If you still feel as a candidate for lump-sum rather than annuity/pension, then we can start exploring the Monte Carlo outcomes with some asset allocations lowest required (from (v))< asset allocation < highest permissible (from (vi)); use the Capital Market Expectations in Figure 1 (Part 3) to get the Expected Return and Standard Deviation corresponding to the asset allocation chosen.
You now have all the input data necessary to start entering it into the Monte Carlo spread sheet (items shown in red font are the only permissible inputs) which can be accessed as follows:
The link to the Monte Carlo simulation spreadsheet is available at http://1drv.ms/1pZoseS but to execute this macro based spreadsheet you’ll have to open it in Excel and run it locally on your computer:
- To do this in Excel 2007: click on the link, then in Online Excel: Go to File, Save As, Download a Copy, and then Open (which will open it in the Excel application on your computer. To enable macro you’ll have to Click on “Options” (just above the spreadsheet) then click on “Enable the macro”, and to run example once you have specified the inputs, you’ll have to click on the large Blue button.
- To do this in Excel 2010: Enable editing (disabled for security reasons), Enable content/macros (disabled for security reasons), Make macro visible under tab View/Macros/View Macros (The name of the Macro is CalcNow_Click)
Also note that in the spreadsheet, only items shown in red font are permissible inputs.
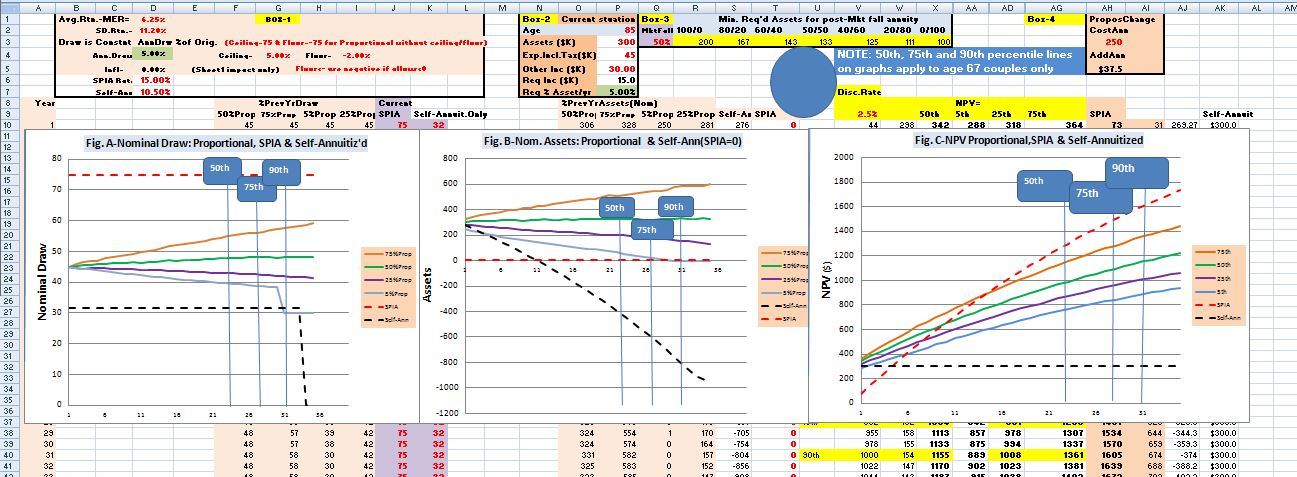
You are now ready to explore different scenarios applicable to your circumstances. (Remember that the vertical lines labeled as 50th/75th/90th age-percentiles on each of the graphs are the joint life expectancies for a 67 year old couple. So you will have to use instead your life expectancy numbers instead, as you analyze the outputs)
Scenario 1
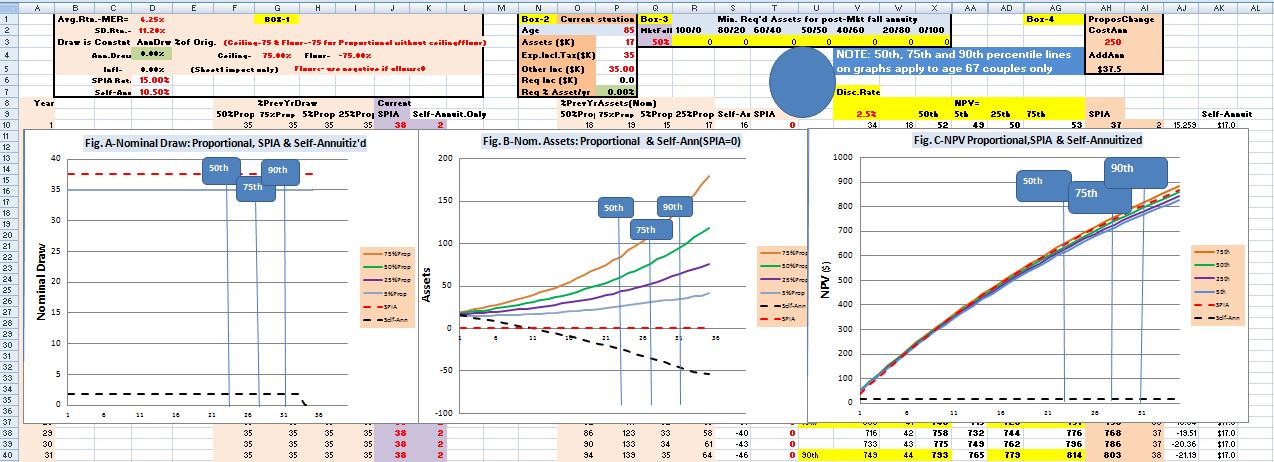
So back to the context of this 85 year old male, who needs (net after pensions) additional $35K annual income and only has $250K assets, and no flexibility on the income needs (i.e. all $35K is fixed requirement, then the annuity is the only way to proceed, but we could secure the $35K/yr fixed annuity and use the remaining $17K which hopefully we’ll be able to use as a source of emergency (cash) reserves or to create investment portfolio which might grow and might be a way to recover the income erosion due to inflation. to create investment portfolio (Use proportional (implemented in the simulator as ceiling=+75% and floor=-75%) rather than the typical ceiling=+5% and floor=-2% draws, as the withdrawal from portfolio is not required (at least initially) to compensate for inflation.) At this level of available assets and this income requirement is a case when the insurance provided by an annuity is likely necessary. When analyzing the results of the following simulation outputs, remember that the 85 year old male has 5.1, 8.4 and 11.5 years as the 50th, 75th and 90th percentile life expectancies.
Scenario 2
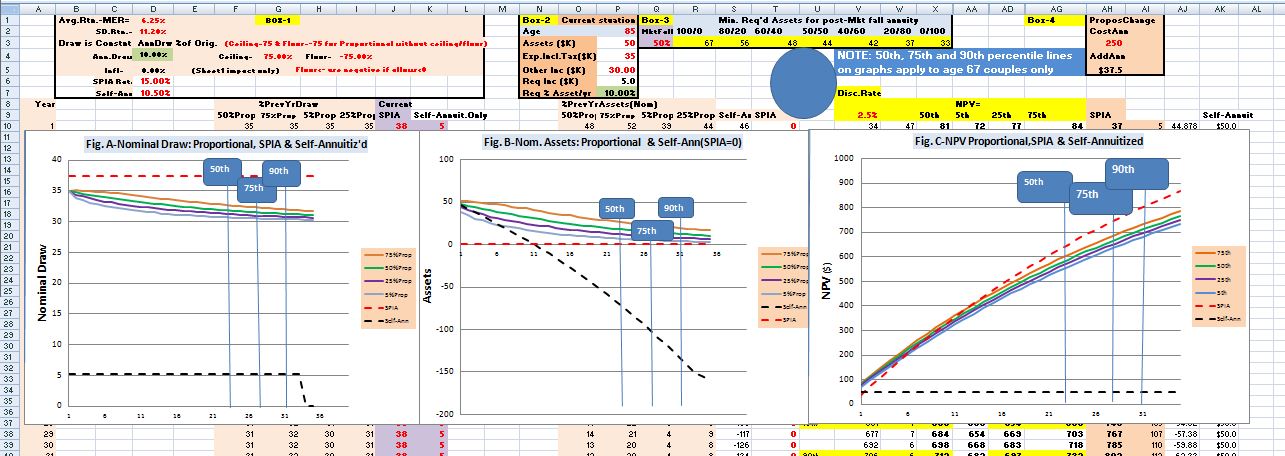
This is the same as Scenario 1, except suppose that on $30K/yr of the $35K/yr income is ‘fixed’ requirement is fixed income, and the other $5k is discretionary income requirement. Then we could buy a $30K/yr annuity income with $200K (at 15% annuity rate) and the remaining $50K of assets could then used as an investment portfolio from which we aim to draw $5k/yr (at least initially). (Again we use unconstrained proportional (implemented as ceiling=+75% and floor=-75%) rather than ceiling and floor constrained draws, as the withdrawal from portfolio is not required (at least initially) to compensate for inflation.) Again, at this level of available assets and this income requirement is a case when the insurance provided by at least a partial annuity is likely necessary. Note in the simulation below with the stated assumptions, that even at age 100 the income delivered would be between $31 and $33K (at 5th and 75th percentile return points) but there would also be $10K-$35K assets remaining as reserve. By only annuitizing $30K, we are trading off somewhat lower annual income for higher reserves.
Scenario 3
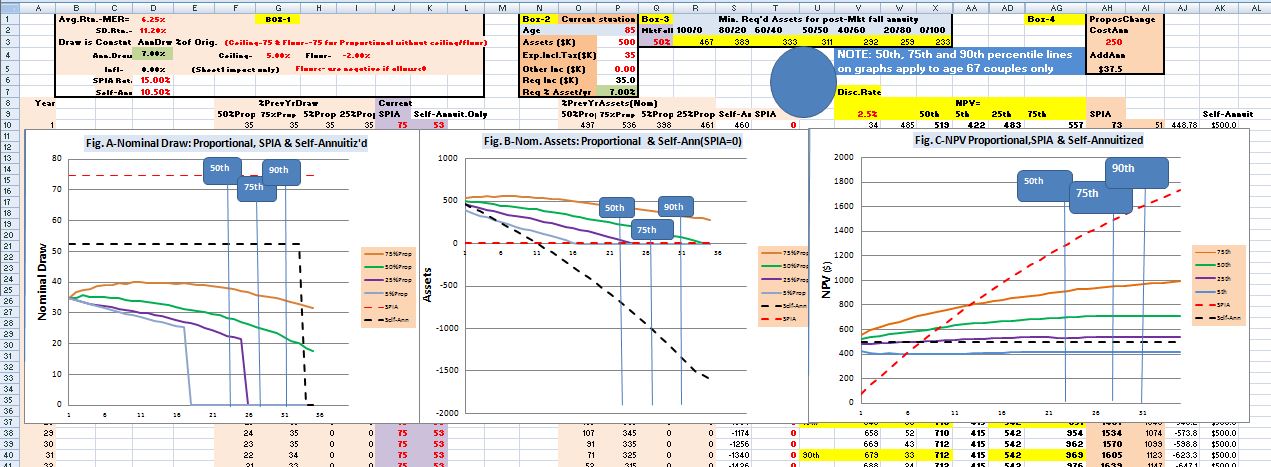
Now consider that the $35k/yr income requirement but with available assets of $500k (instead of $250K); the situation is very different. We can now relying on the portfolio draw to generate all the required income, so we’ll constrain the draw with a 5% ceiling and -2% floor in order to reduce income volatility, as discussed earlier. As you can see from the Monte Carlo simulation the expected 50th percentile performance curve delivers after 15 year (age 100) over $31K/yr with remaining assets still at about $350K; furthermore, even the 5th percentile performance curve doesn’t exhaust assts until about year 17 (age 102 for this 85 year old male) and opportunity exists to made midcourse corrections including a switch to an annuity should extreme portfolio losses occur. Also note that NPV of annuity is below that of the systematic withdrawal approach up to about year 10 (age 95, i.e. at about 85th age percentile point for the life expectancy of an 85 year old male)
Scenario 4
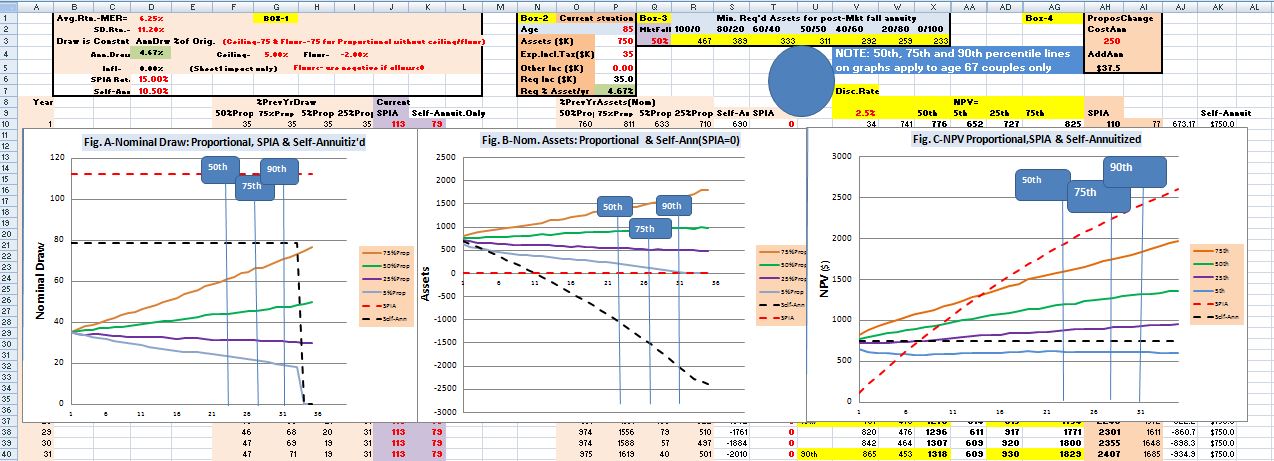
We can also look at the scenario when income requirement is $35K/yr but assets are now $750K, and as we can see, the expected income is growing each year reaching about $41K by age 100 and assets increasing from the initial $500K to over $800K; even the 5th percentile performance curve shows at age 100 $26K/yr income and over $300K assets, suggesting a comfortable margin for mid-term correction should the worst performance manifest itself.
Scenario 5
A final scenario to consider is when assets are $500K, income requirement is $35K of which $30K is fixed and $5K is discretionary, then we could consider buying an annuity of $30K for $200K, leaving $300K for a portfolio from which we draw using a systematic withdrawal strategy. And suppose we allow the annual income requirement to increase to $45K/year. Then we see the expected income delivered to be about $45K and assets to stay flat at about $300K. Even the 5th percentile performance curve would only drop to about $41K/yr while remaining assets are indicated to be over $100K. Note, that compared to Scenario 3. Note here that at the cost of giving up some assets (and NPV) should you die “earlier”, then you can secure a higher and more consistent expected income up to age 100 (very low probability event for as 85 year old male with a 95th percentile life expectancy of 98.5), a narrower spread of higher income and narrower spread but lower assets, when compared to Scenario 3. Scenario 5 might be considered by some as a more comfortable ride compared to Scenario 3. We also have to remember that while annuitization is just trading-off longevity risk for inflation risk, inflation risk for 85 year old male with a 5 year life expectancy is much lower than for a 67 year old couple with a life expectancy of 23 years.
Bottom line
This Part 5 blog post pulls together, how one might go about exploring the annuity/pension vs. cash-value decision. Clearly, while the decision is very often not obvious, at times is very clear; if your fixed annual income requirement is of the order of what the pension delivers then you have very little flexibility should you expect to live to at least your age group’s life expectancy, you pretty much have to go with the pension/annuity. At the other extreme, if your assets and income requirements are such that the withdrawal requirement from the assets is much smaller percentage than that delivered by an annuity, then annuity might not be a serious consideration. In between the extremes you might be able to make do without annuitization, or possibly a partial or deferred annuitization. The example shown in this blog post also shows how at in some situations at age 85 (especially for a male) a fairly priced annuity can add value for those who are in good health and life expectancy greater than average 85 year old; it also helps that at mortality credits are much higher and that inflation will have less time to eat away at the annuity generated income stream. There are no generalizations possible due to differences in individual circumstances/context, changing capital market expectations, but since annuitization in not reversible, and you may be able to annuitize later if necessary, so maintaining flexibility is likely a virtue.
P.S. For those considering the lump-sum (commuted value-CV) option rather than a pension, you need to also understand whether in your situation there are some immediate tax implications, as there might be caps which limit the maximum transferable amount into a LIF under Canadian pension rules. Also, for Nortel pensioners in Canada, you must factor in that according to my current understanding of the rules governing CV (commuted value) calculation older Ontario pensioners might be more heavily penalized when they choose CV, as discussed in Nortel pensions: Why CV/LIF value is less than annuity value for Nortel’s Ontario pensioners? .

The exercise and example is very good. i was trying to open and download the link provided at two locations but both are not working.
The link to the Monte Carlo simulation spreadsheet is available at http://1drv.ms/1pZoseS
and
To do this in Excel 2007: click on the link, then
Could you please share the spreadsheet on my email?
Hi Dilip,
Not sure what you are trying to exactly do, but if you give me an idea of it then perhaps I can point you to an appropriate direction. In the meantime…
The bad news is that I have also been having trouble with oneDrive access of old (this one is 2014) Excel files in general, and Excel 2007 files in particular.
The good news is that I am less enthusiastic with Monte Carlo simulation approaches than I was in 2014, but more recently, I have become more enthusiastic about using the method described in the following blog-post Stocks in retirement? Asset allocation considerations in retirement . https://retirementaction.com/2015/05/27/asset-allocation-considerations-in-retirement/
This is simpler to use and the results are easier to interpret. It is framed in terms of required and maximum permissible stock allocation in retirement. You might find it more useful.
All the best…Peter