
Vanguard’s GLWB: Credit to Vanguard for delivering on the promise
(Originally posted November 7, 2011 and re-hosted in March 2012)
In a nutshell
Vanguard’s GLWB finally meets the promise of the value inherent in GLWB/GMWB-like strategies. We can only hope that Vanguard will also offer this product eventually in Canada.
Vanguard’s GLWB is a great compromise between annuities (where you lose control of your assets and have a major inflation exposure) and proportional strategies with or without Floor and Ceiling, where you have residual market and longevity risk. Furthermore the Vanguard GLWB also balances the market/longevity/inflation risks taking somewhat of a middle road.
As indicated before, locking in a strategy upon retirement and expecting to leave it unchanged over 30-40 years is completely unrealistic. With the Vanguard GLWB approach you maintain full access to your assets, get downside protection and upside opportunity. (Warning: Just like in funds (mutual or ETF), which are not all created equal, investors must pay attention to costs and ‘features’. Do not assume that other GLWB/GLMBs do the same; the primary differentiating parameter is cost/fee associated with the product, though not the only difference.) So if you are looking for one strategy that can last a lifetime, then one might say flexibilityis it!
In this blog a preliminary assessment is offered by comparing Vanguard’s GLWB to high-cost GLWBs and other tools in the decumulation toolbox like: proportional withdrawal with and without a Floor and Ceiling and single premium annuities, using the same capital market assumptions. Other useful toolbox variables were not considered here, such as changing asset allocation (away from a balanced portfolio) with risk tolerance and increasing withdrawal rates with age.
GLWB/GMWBs can now be safely added to the decumulation toolbox; well at least Vanguard’s GLWB. The tools in the box can be used alone, in combination or in sequence as one’s risk tolerance changes.
All these approaches have inherent value but only when they are implemented in an “investor friendly” manner. “Investor friendly” starts with “low-cost”, as the available market returns are the same for everybody and cost of ‘product’ just reduces available return to the individual. GLWBs, like annuities, have an insurance component. The insurance component guarantees a minimum lifetime income thus addressing downside market risk (and implicitly longevity risk). Fixed annuities boost available market returns with the mortality credits when group of investors give up some or all access to their assets, and those living longer benefit from assets freed up by those dying earlier; much of the advantage of annuities is eroded by high costs. (Another product that I’ve been advocating for since about 2003 that is needed for the decumulation toolbox is a pure longevity insurance product, now available in the U.S. but still not in Canada.)
Vanguard’s GLWB finally meets the promise of the value inherent in GLWB/GMWBs. We can only hope that Vanguard will also offer this product in Canada and perhaps even a pure longevity insurance product (though these would require overcoming the challenge of finding a Canadian insurance company to partner with.) These would be wonderful options for many Canadians in general, and some Nortel pensioners who will shortly have to choose between a dramatically reduced annuity and a LIF.
Background
In my earlier blogs on GMWBs the name used for for variable annuity like products with guarantees in Canada, called GLWBs in the U.S., pretty much suggested to stay away from these products as they offered no value except for the “hope over reality” of an upside that investors often engage in when they come face to face with complex/opaque products. This just shows you, how good ideas can be subverted by an investor unfriendly approach.
In GMWB I,I reviewed the context for these products which offered the ultimate marketing magic of “downside protection while preserving the upside opportunity”. The context is simply the rapid disappearance of traditional Defined Benefit (DB) pension plans in the private sector, and the corresponding move to Defined Contribution (DC) plans and RRSP/IRAs resulting in a transfer of market/inflation/longevity risk from the employer to the individual. This resulted in a hunger for decumulation “products” for retirement (fixed annuities, managed income and GMWB/GLWB-like products which effectively guarantee a minimum (15-20 years initially but ultimately) lifetime income (which partly tries to deal with longevity and market risk, but as delivered until now did nothing for inflation risk.)
GMWB II explained how with the then available GLWB/GMWB-like products and combined investment management and guarantee fees in the 3-4% range result in little or no upside in the capital markets context of 2007-2008 when these blogs were contemplated and written; in fact, they were inferior to annuities. I also suggested there that at a total cost, including guarantees, of under 1.5% rather than 3-4%/year GMWBs might start to get interesting (and even more so after the market rout of 2008 and the unimaginably lower interest rate environment since then; and Vanguard now delivered at 1.45% as we’ll see below). Finally, I then suggested that there was a case to be made even for conservative (balanced portfolio) investors to consider an annual withdrawal strategy in the 4-5% range based on previous year-end assets (I’ll adopt for this the nomenclature used in Marston’s recent book “Portfolio Design”where he called it “proportional” strategy) which results is a superior expected outcome though with a small probability of a lower than annuity income. But there is no plan that one can realistically expect to put in place at time zero and expect to stay with it unchanged for the next 40 years (except immediate annuities, but of course then you lose control of the annuitized assets and you have no inflation protection.)
So for those who wanted retirement income they used to get a single-payment immediate fixed-annuity (SPIA) or a portfolio of stocks and bonds trying to live ideally off the interest and dividend income. Other options emerged were variable annuities (which allow investor to select funds from a list, offer regular retirement income, some tax deferral and options such as death and other benefits at extra cost), and more recently these added guarantees of some minimum income for life. Products also emerged to provide systematic withdrawal (e.g. Vanguard’s unfortunately timed but still nery effective Managed Payout funds, which were released a few months before the 2008 market meltdown; though the withdrawal rates are not explicitly specified as a fixed percentage, but rather in terms of the objective of preserving initial nominal capital, or real capital or growing real capital) based on the “proportional” withdrawal strategy. Last year Vanguard published some refinement to the proportional approach in “A more dynamic approach to spending for investors in retirement” whereby withdrawals are constrained by a specified “floor” and “ceiling” on the permitted year-on-year change in dollars drawn, to moderate retirement income volatility of the proportional approach.
Last week Vanguard, the king of low cost indexing, announced in the U.S. market a GLWB with the following properties, as described in “Steady income with growth potential and market protection”:
-select from one of Vanguard’s three available variable annuities: two balanced index based funds (MER=0.5%) or an actively managed fund (MER=0.6%)
-cost of the guarantee (“subject to claims-paying ability of issuing insurance company”) is 0.95%/yr (you may choose to discontinue the guarantee option at any time and the cost of the guarantee may change for future premiums/contributions with a 2% cap)
-ability to stop, start, skip or even make extra (but extra affects guarantee) withdrawals and have “unconstrained” access to assets
-guaranteed lifetime minimum withdrawals are specified, including an annual ratchet feature of the guaranteed minimum income when asset value increases
-guaranteed withdrawal percentages are specified for age ranges 59-64, 65-69, 70-79 and 80+ at unisex single rates of 4.5%, 5%, 5,5% and 6.5%, and for joint rates of 4%, 4.5%, 5% and 6%, respectively.
– (but) residual asset value is not guaranteed on the downside or upside, might even exhaust in very bad markets (even though minimum income ratchet might have kicked-in)
Simulation methodology, results and comparisons
So how does Vanguard’s new GLWB stack up against some of the other alternatives?
Consider a 65 year old couple with a $100 retirement savings when capital market expectations suggest that the we might expect from a 50:50 stock/bond balanced portfolio a Return (R)=7% and Standard Deviation (SD)=9%. (An investor could make his/her own judgement on these expectations by reading various sources, such as “Vanguard’s economic and capital markets outlook”, and adding one’s own judgement.) We use Monte Carlo techniques (1000 iterations for illustrative purposes; 10,000 would be better but would not likely change results dramatically but would have added considerable time for me to do this preliminary assessment of the product) to compare a number of decumulation strategies over a very conservative 40 year retirement for a 65 year old couple. To translate nominal draw rates and asset values to real values in the simulation results we used annual inflation deflator of 2.5% for the Draw (income) and (residual) Assets. Making the usual normal distribution assumptions for returns is questionable, however we’ll keep in mind mathematician Richard Hammond’s admonition that ”computing is for insight not numbers”, so we’ll proceed with the simulations.
The following acronyms are used as short-cut identifiers for what follows:
-‘GLV’= Vanguard’s GLWB as described above for a 65 year old couple, with initial guaranteed minimum lifetime income specified by the product at a joint rate of 4.5% and the total cost of 1.45%(0.5%+0.95%) to be simulated as R=6.5% (7%-0.5%) and a Guarantee cost of 0.95%
-‘GLH’=High-cost GLWB for simplicity is assumed to have same characteristics as the ‘GLV’ except total cost is 3.5%(instead of 1.45% for the ‘GLV’)
-‘Prop’= Proportional strategy where annual draw is some specified proportion/percentage of previous year end assets. The scenario considered will use annual Draw=4.5%(as in the case for GLWB’s initial draw and starting minimum rate)
-‘PFC’= Proportional strategy with Floor and Ceiling where the proportional approach is used, but annual changes to the value of the Draw are constrained as a specified percentage of Floor and Ceiling on the Draw. The scenario considered will use a Draw=4.5% with a Floor=-1.0% and Ceiling=5.0%(Other values of Floor and Ceiling may be explored, though were not explored systematically here.)
-‘SPIA-J’= Joint Single Premium Immediate Annuity for a 65 year old couple with payments continuing until either of them is alive. The rate available for such a couple this week from Berkshire Hathaway Insurance was Joint-rate=5.2%(The single male and female rates, by the way, were 6.3% and 5.8% respectively.)
The capital market expectations of a balanced portfolio is assumed to have a return of 7%and the Standard deviation of 9%; with the management fee being 0.5% thus the Vanguard balanced portfolio including the cost of guarantee: for GLV we use R=5.55% and SD=9%. Similarly for the High cost balanced portfolio with total cost of 3.5% then: for GLH we use R=3.5% and SD=9%.
Comparison #1: GLH (R=3.5%, SD=9%) vs. GLV (R=5.55%, SD=9%) vs. SPIA-J (Draw=5.2%)

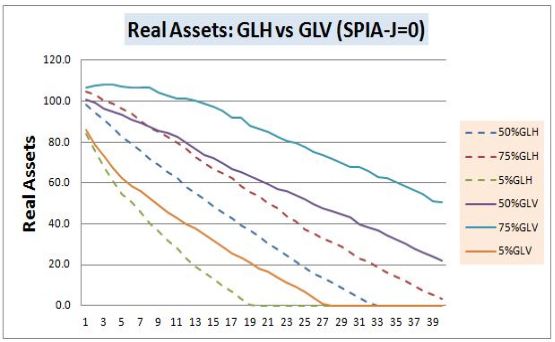
For each Monte Carlo simulation we look at both Real Draw and Real Asset at the 5%, 50% and 75% -ile points. The solid lines represent the Vanguard product ‘GLV’, the dotted lines the High-cost product ‘GLH’, while the annuity payout is fixed at $5.2 (i.e. 5.2% of initial asset value of $100 all adjusted for annual inflation erosion of 2.5%) is shown as the thick dashed line (The annuity Assets are always zero in this model and are not show on the graph.) The conclusions of this comparison are:
-‘GLH’ draw has little value to recommend it over an annuity; even the 75%-le points are only about 10% higher than the annuity. The median draw is always below the annuity value. Compared to ‘GLV’, the ‘GLH’ never has an advantage.
-‘GLV’ upsides include: (1) after 8 years the median is higher than the annuity, (2) unlike the ‘SPIA-J’ which always has zero asset value, the GLV median asset value does not exhausts over the 40 years; median real asset value is 50% even after 15 years, while the 5%-ile value only exhausts after 27 years
-‘GLV’ downside is that: the 4.5 minimum withdrawal level is only 13% below the annuity’s 5.2%
Bottom line: while ‘GLH’ in still not recommended (don’t buy any high fee GLWB/GMWBs), Vanguard’s GLWB (‘GLV’) may be preferred by less conservative investors/retirees over annuities due to the above upsides.
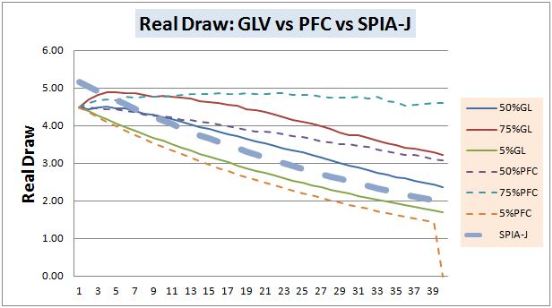
Comparison #2: ‘Prop’ vs. ‘PFC’ vs. ‘SPIA-J’


In the above graphs we compare the Proportional strategy ‘Prop’ which is unconstrained, (i.e. has no Floor or Ceiling) against the constrained Proportional strategy with a Floor and a Ceiling, labelled ‘PFC’; in this case the parameters used are Floor=-1.0% and Ceiling=5.0%.
-The upside: ‘Prop’ and ‘PFC’ perform very similarly at the median and 75%-ile points and offer superior/growing Draw advantage over the annuity after 10 and 4 years, respectively. Draws become 150% and 250% of the annuity after 40 years, thus typically promising inflation protection opportunity. On the Asset side, compared to the zero annuity value, even the median point after 40 years remains above 70% of the original buying power, and at the 5%-ile level the ‘Prop’ asset only exhaust after 40 years and the ‘PFC’ assets are still at about 30% of the original (or real) buying power after 40 years
-The downside: after 7 years the 5%-ile points of the draw of ‘Prop’ and ‘PFC’ are were a steep 35% and 20% below the annuity level
Bottom line: There is sufficient compelling upside with the Proportional Floor and Ceiling approach (‘PFC’) that more risk tolerant investors/retirees might choose this option over annuities; there is no compelling reason to shoot for the moon with the ‘Prop’ (though maximum possible draw would be greater) compared to the ‘PFC’ strategy
Comparison #3: ‘GLV’ vs. ‘PFC’ vs. vs. ‘SPIA-J’
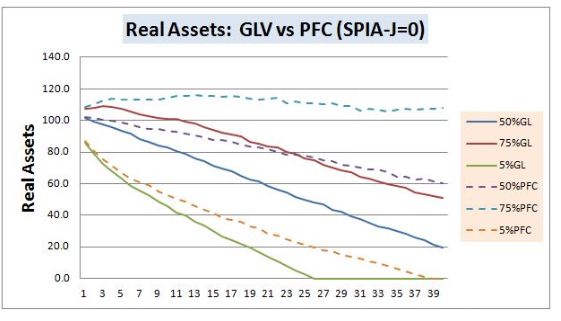
Given that ‘GLV’ (just labelled as GL on the above graphs) is always preferable to ‘GLH’, and ‘PFC’ might generally be preferable to ‘Prop’, then in the next pair of graphs (above) we compare ‘GLV’ to ‘PFC’ and ‘SPIA-J’.
The upside: at the median and 75% level the real draw of ‘PFC’ is always higher and increasingly so compared to ‘GLV’, and median and 75%-ile of ‘PFC’ beats ‘SPIA-J’ after 4 and 7 years respectively. On the asset side the advantage of ‘PFC’ over ‘GLV’ is clear ‘PFC’ being about 50% and >100% ahead of ‘GLV’ after 20 and 40 years respectively
The downside: at the 5%-ile level after 20 years the real draw of the ‘PFC’ and ‘GLV’ are 25% and 13% lower than ‘SPIA-J’ and the real asset of ‘GLV’ and ‘PFC’ exhaust, but only after 27 and 40 years, respectively.
Bottom line: For those more interested in higher assets and are more risk tolerant the ‘PFC’ will be preferred, whereas less risk tolerant of lower income/draw will lean to ‘GLV’.
(Interestingly some might make a reasonable case for using the ‘PFC’ with parameters Floor=0% and Ceiling=5% instead of the ‘GLV’; the median, and 75%-ile draw points of the ‘PFC’ > ‘GLV’ and 5%-ile is the same as the ‘GLV’ guaranteed minimum for 34 years of retirement, exhausting in the 35th year. Assets are always ‘PFC’ > ‘GLV’ at the median, 75%-ile and 5%-ile. The risk is that with at some lower return or higher volatility than the assumed capital market expectations, the ‘PFC’ assets exhaust even earlier than 35thyear, and Floor=0% holding draw rate at 4.5% would still result in is a zero draw; whereas the ‘GLV’ provides a guaranteed minimum income. The superior performance of the ‘PFC’ until its assets exhaust is due to the additional annual insurance cost of the ‘GLV’.)
GLV sensitivity analysis
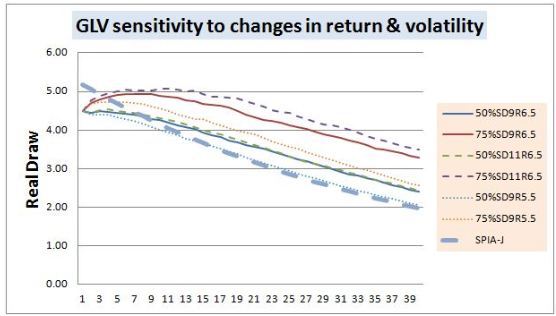
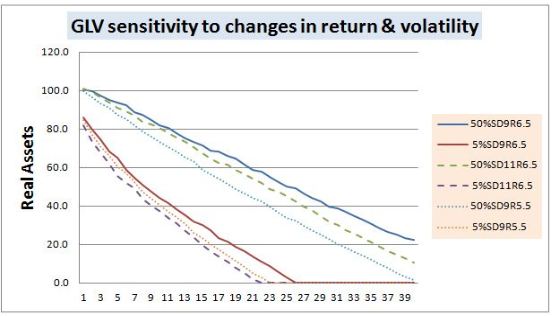
We don’t really know what Return and Standard Deviation the future may deliver. So in the above graphs we now explore the negative impact on ‘GLV’ if Return (net of MER of 0.5%, but not guarantee cost) actually is 1% lower at R=5.5% (vs. 6.5%) and separately if we have 2% higher Standard Deviation SD=11% (vs. 9%). The base case is the original R=6.5% and SD=9%.
The upside: increasing volatility to SD=11% increases the 75%-ile point of ‘GLV’ draw by about 5-8% and has no perceptible effect on the median; similarly is has no effect on the 5%-ile level because of the ‘GLV’ minimum guarantee. So (assuming that return and risk are correlated) you want as risky a portfolio as the insurance company guaranteeing the minimum withdrawal will permit; as it is all upside for the investor. After about 7 years, all cases considered have superior draws to the ‘SPIA-J ‘
The downside: Reducing return by 1% reduces median real ‘GLV’ assets by <10% after 20 years and at the 5%-ile level exhausts assets after 22 rather than 26 years. Similarly increasing the volatility by 2% reduces median real ‘GLV’ assets after 20 years by about 25% and at the 5%-ile level exhaust occurs after 22 rather than 26 years.
Bottom live (overall):
With the U.S. availability of Vanguard’s new product, not only will the reputation of such GLWB/GMWB-like products be rehabilitated, but GLWBs now finally become credible contenders for lifetime income generation in retirement. Hopefully, this product will in due course become available in Canada as well.
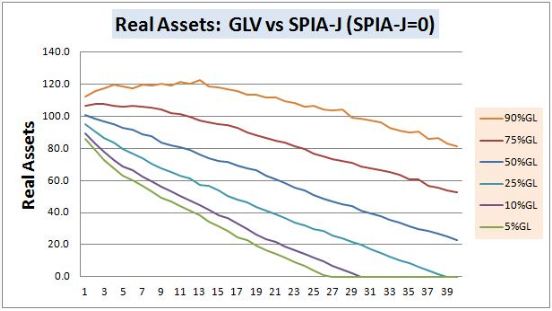
The following couple of graphs compare Vanguard GLWB’s 5%, 10%, 25%, 50%, 75% and 90%-ile levels against the joint SPIA-J. My sense would be that most people after some reflection would choose the Vanguard GLWB over the SPIA-J because:
The downside: (1) in the worst case scenario, when the draw level would be governed by the minimum guarantee, the penalty is 13%, (2) at the 25%-ile draw points the GLWB is only 5% lower, end even more importantly (3) the median draw crossover with the ‘SPIA-J’ occurs after 8 years, we still have a tremendous upside
The upside: after 8 years when the median draw points crossover the SPIA curve, the GLWB assets are still at 82% of their original buying power while the SPIA is zero! Furthermore the GLWB’s draw advantage continues to grow after year 8 and it becomes 25% greater after 40 years (and as mentioned above, that is just the median with half the outcomes being even higher.

Depending on retirees’ risk tolerance they can now look at the total toolbox: (1) annuities (SPIA’s), (2) low-cost GLMB/GLWBs (like ‘GLV’), (3) constrained proportional withdrawal strategies with floors and ceilings (‘PFC’) and (4) unconstrained proportional withdrawal strategies (‘Prop’); each of these choices comes with a low probability but increasing risk of worst case income outcomes. However, an overly conservative approach to income risk will expose retiree even more to inflation risk.
Let’s take a qualitative look comparing annuities (SPIA-J), Vanguard’s GLWB (GLV), Proportional with Floor and Ceiling (PFC), and Proportional (unconstrained) ‘Prop’ strategies.
Risk*
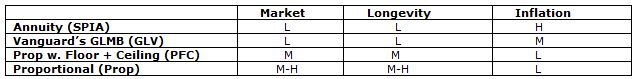
*It would be inappropriate not to mention the insurance company risk with SPIA and GLWBs; ultimately there are no absolute guarantees in life (except for death and taxes)
As you can see the Vanguard’s GLWB is a great compromise between annuities (where you lose control of your assets and have a major inflation exposure) and proportional strategies with or without Floor and Ceiling. Furthermore the Vanguard GLWB also balances the market/longevity/inflation risks taking somewhat of a middle road.
As indicated before, locking in a strategy upon retirement and expecting to leave it unchanged over 30-40 years would be good definition of insanity. With the Vanguard GLWB approach you maintain full access to your assets, get downside protection and upside opportunity, (Warning: Do not assume that other vendors’ GLWB/GLMBs do the same; the primary differentiating parameter is cost/fee associated with the product, though not the only difference). So if you are looking for a strategy, then one might say flexibility is it! For example depending on one’s risk tolerance, one might start using the Proportional method and as/if one’s risk tolerance decreases move to a Proportional with Floor and Ceiling; in addition, though not considered here, one has the option to not just adjust withdrawal rate based on portfolio performance as implied by the PFC methodology, but also to adjust upward percent withdrawal rate as one ages (and expected remaining lifespan decreases). If one’s risk tolerance is lower or decreases due to poor market performance) then moving to Vanguard’s GLWB (or even an annuity) might be the next step. One might even choose a mix these decumulation strategies.
Remember, that all these approaches have inherent value when they are implemented in an investor friendly manner. “Investor friendly” starts with “low-cost”, as the available market returns are the same for everybody and cost of ‘product’ just reduces available return to the individual. GLWBs include an insurance element which guarantees a minimum lifetime income thus addressing downside market risk (and implicitly longevity risk). Fixed annuities (e.g. SPIA-J here) boosts available market returns with the mortality credits which become available to a pool of investors who give up some or all access to their assets, those living longer benefiting from assets freed up by those dying earlier; much of the advantage of annuities resulting from this mortality kicker is eroded, except for the most conservative of investors who’d otherwise invest in long-term government bonds, because the annuity income is built on the assumption that that’s what you’ll be invested in and costs can be high. The ‘Prop’ and ‘PFC’ can be implemented by DIY investors without access to financial ‘products’ (other than low-cost vehicles like GIC/CDs and ETFs, without using expensive mutual funds). GLWB/GMWB-like and annuity-like constructs add insurance ‘products’ into the toolbox of available decumulation products, but the potential additional value can be partially or wholly lost when they are delivered at high costs. (Another product that I’ve been advocating for since about 2003, that is needed for this decumulation toolbox is a pure longevity insurance product, now available in the U.S. but still not in Canada.)
Vanguard’s GLWB finally meets the promise of inherent value of GLWB/GMWBs. We can only hope that Vanguard will also offer this product in Canada (e.g. it would be a wonderful option for many Nortel pensioners who will shortly have to choose between an annuity and a LIF).

Hello
Your opinion Vanguard GLWB vs. other decumulation strategies | RetirementAction.com is informative & thought provoking, I shall return
often to review the blogs