
GMWB II- Guaranteed Minimum Withdrawal Benefit II
This is a follow-up to the GMWB I blog of a few weeks ago, where I also described the characteristics of typical GMWB products. Here I will compare various decumulation options with the hypothetical GMWB product described earlier and various parameters. This will get a little technical, but please bear with me as the conclusions are valuable, especially if you are thing of getting one of these Guaranteed Minimum Withdrawal Benefit products. The conclusion is that when things look too good to be true, they usually are. (There a couple of follow-up blogs that you might also be interested to read on GMWBs at GMWB III – Q & A: Are GMWBs more desirable investments in “post-2008” context of low interest rates? and Vanguard GLWB vs. other decumulation strategies )
The assumption in the Monte Carlo analysis used is still that the distributions are normal (Gaussian). While it is known that returns of securities are not normal, especially if consider exposure to Black Swans, this is a reasonable assumption to explore alternative scenarios and get some insight into the likely outcomes. The decumulation options compared are: (1) GMWB, (2) draw 5% of previous year-end assets, (3) annual draw of 5% indexed to inflation, (4) 5% fixed (CD/GIC) and (5) joint annuity of 5.9% annual pay (un-indexed). The comparison will be done both from a remaining assets and annual draw perspective, all in real dollars (i.e. dollars adjusted for the assumed 3% annual inflation).
I have received un-indexed joint annuity quotes for a 60 year old couple (no minimum payment period), from AAA U.S. source of 5.9% and a (less than AAA) Canadian source of 5.6%. I have used the 5.9% as the reference point, but the conclusions would hardly be different if the lower figure was used. I have chosen a joint annuity, rather than a male and/or female one with higher payout, as one of the benchmarks because if the couple annuitizes all or a significant portion of their assets, the income stream must last until the second one of the couple dies.
Also I’ll assume throughout that we are looking over a 40 year horizon (60 years old couple expecting that at least one will live to 100). The couple is working with a $100,000 portfolio. Inflation is 3% per year and, unless stated otherwise, capital markets deliver on the couples’ portfolio a Return=7.5% with Standard-Deviation= 7.5%. For simplicity taxes are assumed to be zero, even though this assumption may somewhat disadvantage or advantage some of the products (e.g. annuities are disadvantaged, GIC/CDs are advantaged, etc) Note that, while the graphs are labeled as ‘median’, some of the cases under consideration have no variation around the ‘median’ (e.g. 5% CD/GIC, 5.9% joint annuity), while at times we will be discussing 25-or-75 percentile performance, when so indicated.
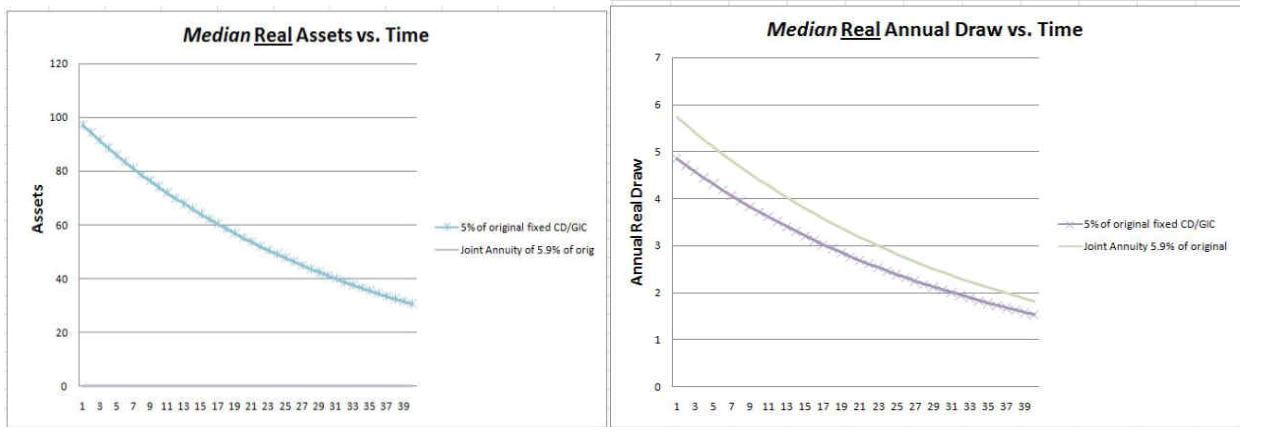
Scenario #0 This is the very simple case comparing taking a 5.9% un-indexed joint annuity (with zero residual value at all times) and a 5% GIC/CD renewable every 5 years.
Result #0– Both income streams erode significantly with inflation, but by taking about 15–20% lower annual income with the CD/GIC the couple still has the original $100,000 at all times (for the estate or emergencies), though significantly eroded by inflation after 40 years. So you may wish to trade off the income vs. the residual depending on your preferences. The other consideration would be if inflation accelerates significantly over the next 5 years, The GIC/CD solution may give you the option to reinvest at higher interest rates in 5 years.


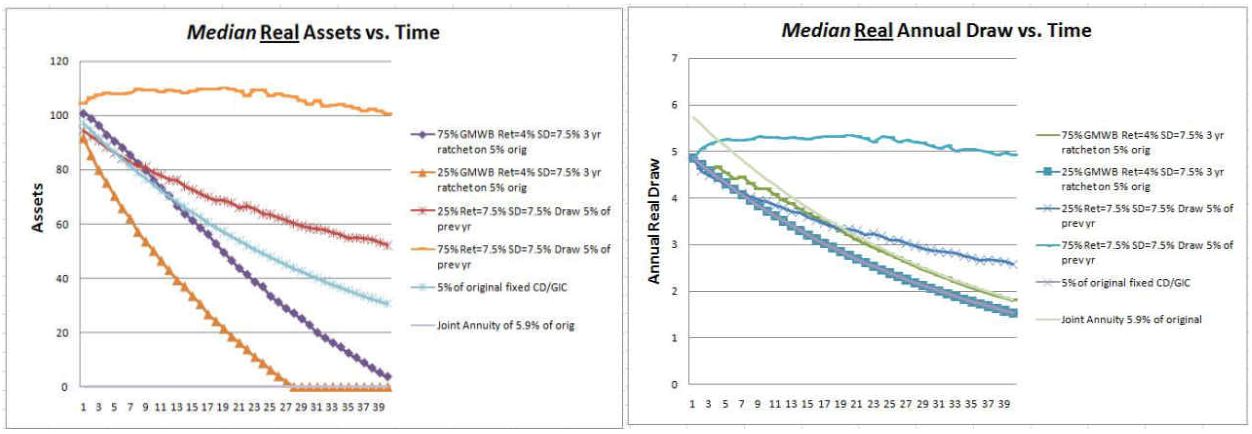
Scenario #1 -Joint annuity of 5.9% -GMWB 5% minimum annual payment, ratcheted up every 3 years (if current asset value is higher than the base used 3 years ago). Annual fees =3.5%, so average returns on assumed portfolio reduce from 7.5% to 4.0%. -draw of 5% of the original $100,000 indexed annually with inflation from the same portfolio. Annual management fee assumed to be 0% (using ETFs we can get to 0.3% or less depending on the portfolio composition but conclusions will not be substantially different) -Assume that you can get 5% interest on a CD/GIC (on May 30, 2008 you can get 4.7%) -Each year draw 5% of the portfolio’s previous year end value.
Result #1: A draw of 5% of the portfolios previous year end value is the best median income stream (and never runs out of money! In fact median assets are expected to be over $75,000 of the original dollars) , except for 5% indexed annual draw from the couples’ portfolio (but with a very high probability of running out of money; see the rapid decrease of the median remaining portfolio value). You will also note that the 5.9% joint annuity consistently delivers higher income stream than the GMWB product (but of course the residual portfolio value is zero at all times.)


Scenario #2 Let’s now look at the same cases as in Scenario #1, except let’s look at the 25 and 75 percentile outcomes (rather than the median or 50 percentile).
Result #2- Note that the annuity beats (or is about the same as) the income stream of the 75 percentile line of the GMWB at all ages (though the portfolio has zero value). While the 25-to-75 percentile spread of the GMWB is quite narrow, as compared to the draw of 5% of previous year end value, the latter is always higher than the GMWB. By the way, the residual portfolio value is also higher than that of the GMWB.
Scenario #3 Consider now if the market performance is superior (or if we chose a much more aggressive portfolio). Let’s assume that the Return=9.5% with a Standard-Deviation= 15%. Of course these higher portfolio returns will be applicable for both the GMWB (i.e. after the 3.5% fee the return is reduced now to 6%) and the case where we draw 5% of previous year end asset value.
Result #3– The ‘median’ GMWB income stream beats the 5.9% annuity after about the first 10 years (but not by a significant amount). However drawing 5% of previous year end asset value results in a far superior median annual income stream and residual assets over the full 40 years, essentially inflation indexed (or better)!
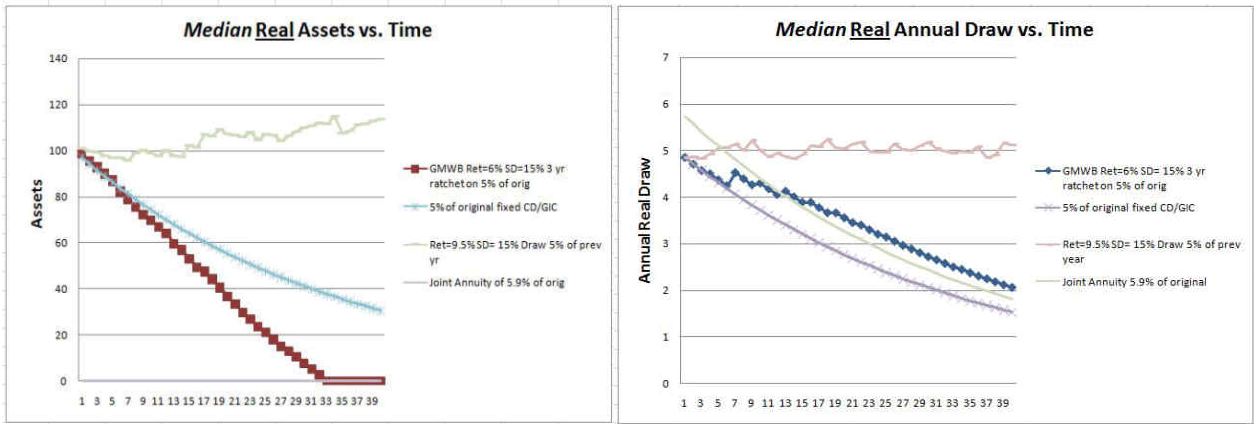

Scenario #4 This is the same as scenario #1 except we reduced the annual fee on the GMWB from 3.5% to 1.5%, resulting in a Return=6% instead of the market offered return of 7.5% per year. The standard deviation stays at 7.5%.
Result #4– GMWB 25-percentile income stream performance is significantly below the annuity, while the 75-percentile performance outpaces annuity after about 7 years. However the performance still lags the 5% draw of previous year end asset value significantly and with a widening gap as time goes on (and fees take their toll).


Conclusions The Guaranteed Minimum Withdrawal Benefit (GMWB) products with a 3.5% management fee have nothing to offer to even conservative investors, even when they are compared to annuities or GIC/CDs. At 1.5% management fee, GMWBs may become interesting to individuals who would otherwise invest in an annuity or GIC/CDs. But over a 40 year retirement, use of GMWB/ Annuities/ GIC/CD exclusively would lead to a relentless erosion of the investor’s purchasing power. In fact over 40 years the purchasing power would be reduced by 70% given an annual 3% inflation.
The most promising approach appears to be 5% of the previous year end value of the portfolio draw. This requires taking a little more market risk than just using CD/GICs in order to reduce inflation risk. The payoff in both likely income and residual assets is too great to ignore. I suspect, that even for a very conservative investor who is leaning toward annuities, they should be used only for part (50%?) of the assets, and even then one may want to do that only in stages and as late in retirement as tolerable.
In the real world, no plan can/will be set into motion and be expected to remain unchanged over a 40 year horizon (except annuities). In the real world there are forces that continuously push you off-course and course corrections will be required. Higher/lower than expected inflation, higher/lower expected returns and volatility, illness, death, unforeseen major expenses and higher/lower expected longevity will guarantee that. You will be required to review even a very good plan every year to insure that you are still on track.
But none of the conclusions should really come as a surprise: -the market offers the same returns to everybody and the same inflationary headwinds -if you move up on the risk curve (even a little bit), you can expect (though are not guaranteed) to get rewarded for the risk taken -if you buy a product with a punitive 3.5% annual fee, you deserve the punishment that you get and what value do you receive for that fee?
So if it looks too good to be true, it usually is!
This page was last modified on Monday, June 02, 2008 12:10:32 PM

Annuities are wonderful rtmrieeent tools. Be wary of Equity Indexed Annuities which you seemed to mention in your last paragraph. The NASD has even intervened in the sale of these products not to mention many lawsuits. I would shy away from fixed annuities with bonus rates and also anything that seems too good to be true. Fixed interest rates are low at this time because bond yields are not so great with rising interest rates. Therefore I would expect an annual interest rate of 4-6% currently. This interest rate will vary in a fixed product and there is usually a minimum rate which I have seen around 3% frequently. We will need to go through certain economic conditions for bond portfolios to yield high rates again and I don’t see that happening soon so expect your fixed annuites to barely outpace inflation. Another option is to annuitize. In doing so you will give up your lump sum in exchange for a payment which the actuaries will calculate based on how long you are expected to live. If you die sooner the insurance company gets your money. If you live to a ripe old age you could take the insurance company to the cleaners as they may have to pay you for life. The downside is giving up control for an income stream and also the kids might not like this option. As for your poor advisor I guess he didn’t have a knack for choosing funds. There are quite a few plausible explanations for this lackluster performance. A diversified portfolio would seem the way to go and at rtmrieeent an 80/20 mix of bonds to stocks or thereabouts might be in order. It sounds as your advisor might have been exposing you to unneccesary risk as your time horizon drew closer to rtmrieeent. The standard deviation or volatility of that type of portfolio would be lower than most. However, if you were in a few based wrap account that charged an annual mgmt fee of perhaps say 1% the advisor would get paid additional trails or monies as the account grew larger. This might provide an incentive to place your account into more aggressive investements in hopes of growth which could fatten everyone’s wallet including yours! The irresponsible part comes in the increased SD or volatility in which the last bear market exposed you too. With a short time horizon there would not be time to recover that 1.2M. Also he should have given you assessments to determine your risk tolerance or as I refer to it sleep quotient . This kind of thing is bad for all of us. You should interview various advisors and place more emphasis on one who cares than how impressive they are. I would deal with someone who is licensed to deal in securities and insurance products. The biggest companies are not always the ones who are going to give you the most attention. Don’t be scared of variable annuities either. Some have fees that are too high however others have lower fees and riders which could give you back your sleep quotient by guaranteeing principle while giving you the opportunity to make market gains! Whatever you do make sure the company you deal with puts the client first rather than putting up a show only to let you down later.